Google NotebookLM Tutorial
This is it! You have decided to give Google’s NotebookLM a try!
Maybe you want step-by-step instructions, or just want to look over the process before diving in. Either way, this tutorial stands ready to help.
What will you do in this Notebook? One suggestion is to upload a group of documents related to a subject or ancestor. These are documents that you want to understand better or analyze. Don’t overthink it. You just need to have an idea of your subject, because once you begin to use the Notebook more ideas will probably come to you.
In this tutorial, we’ll get started with a brand new NotebookLM, add documents to it, then based on those documents generate an Audio Overview, an Infographic, a Slide Deck and a Video Overview.
NOTE: For this tutorial, keep in mind that Google may change how it looks or add/remove specific functionality and labels at any time, but the basic ideas will remain.
When you have decided the topic for your Notepad, it’s time to get going and create it.
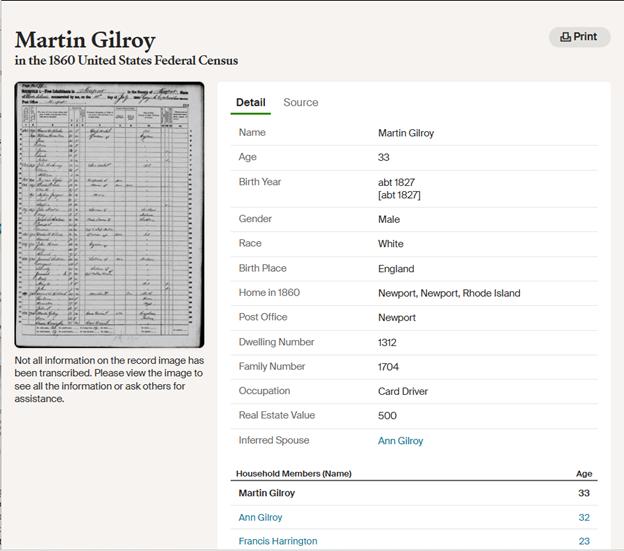
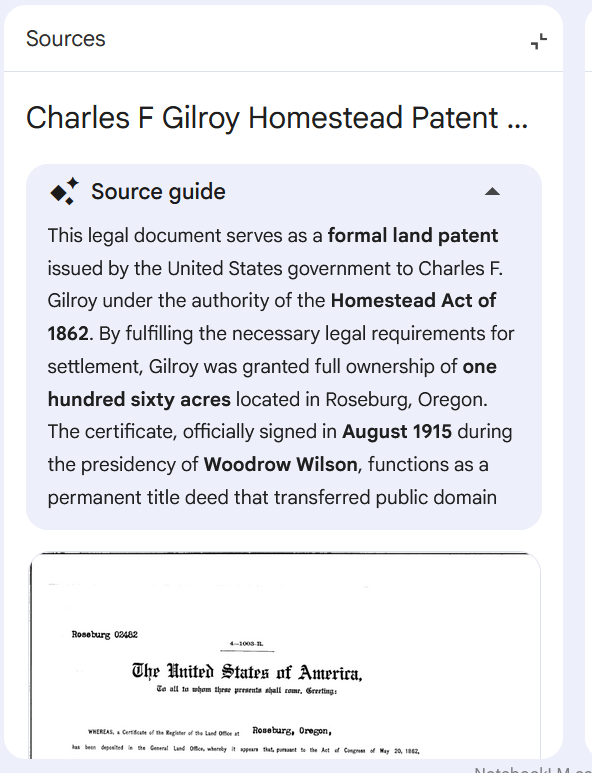
In my example I will add only a few documents: the homestead patents and pages from the tract books for Charles F. Gilroy.
Here’s the link:
https://sites.google.com/view/notebook-lm/login
Login to your Google account here. If you are already logged into Google in the same browser, you may go directly to this page:
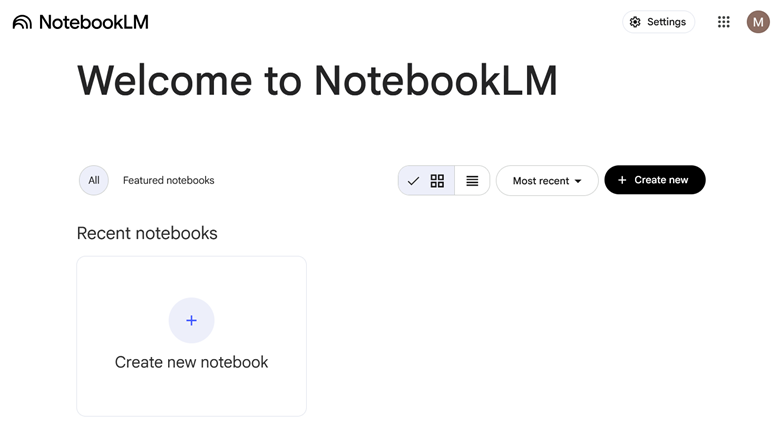
You’re in!
Select Create new notebook to start.
After you have created a new notebook, a window pops up asking you to add media. (This is the same window that will open when you select + Add sources)
As of this writing the Notebook supports: Google Docs, Slides, PDFs, text files, web URLs, YouTube transcripts, and audio files. When you enter a link a YouTube video, only the transcript will be used and the video has to be public.
For best results, enter documents with text in them. There is no guarantee that images will be transcribed properly.
From this window you can drag and drop the files you want to add to your Notebook.

When adding to this Notebook, I have to admit that I did not follow the text-is-best rule. That means I will need to verify the transcription that the Notebook is using was done correctly. I added Land Patents and Tract Book images. (The Tract Book images had been located by FamilySearch Full-Text Search!)
On the left, I selected one of the sources, and viewed a description of the document containing key information from it that had been extracted.
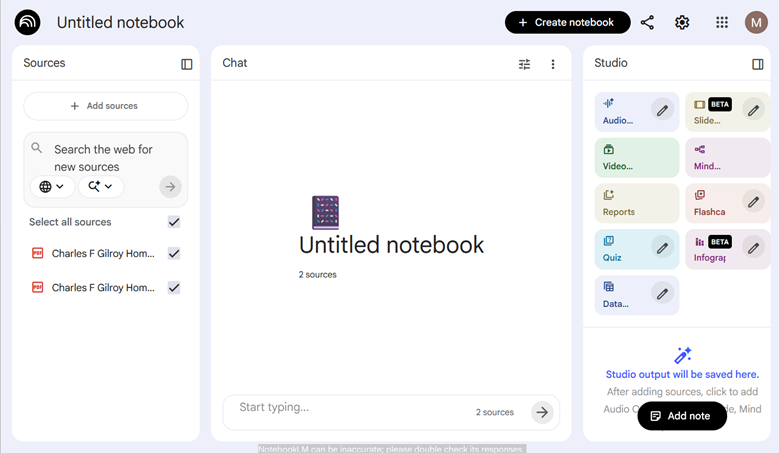
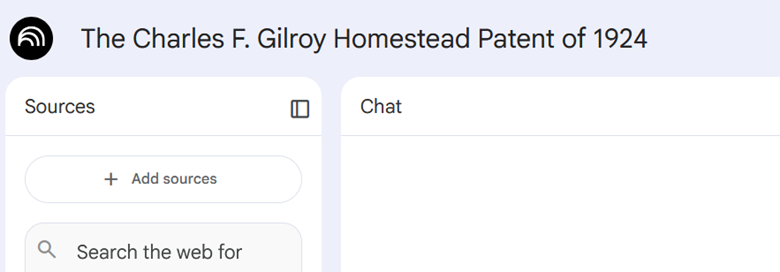
The workspace that opens is called the Notebook, and it has three windows labeled: Sources, Chat, and Studio. The first two are self-explanatory.
The third window is the Studio Window, which is also called the Studio Panel.
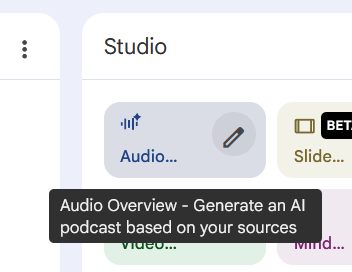
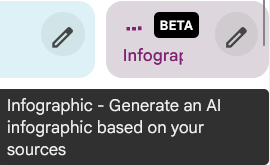
There are two sections within the Studio Panel. One section is home to the buttons, called Action Tiles, where you ask the Notebook to generate complicated multimedia products. By selecting an Action Tile, the Notebook to generate audio or visual presentations, infographic, slide decks, reports, mind maps and more. At this point, several Tiles are labeled “Beta” which means they are almost ready to be full-fledged features but are still being evaluated. Do not let that dissuade you from trying them! Test them out for yourself.
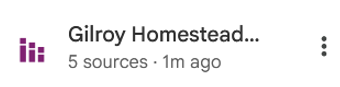
The second section is the Generated Resource List. When you request a product, you will see it added to that list. The list is empty for a new Notebook. As you choose products, the list is populated with the generated media. Next to each resource in that appears in the list there is a 3 dot menu (snowman) where you can Rename, Download, Share or Delete a resource. When you rename a resource, that changes only the name and does not change any of the media’s content.
After uploading the documents, a name for the notebook was automatically generated.
I renamed the Notebook.

Audio Overview
First, I tried an Audio Overview based on the few documents I had uploaded. This action offers to “Generate an AI podcast based on your sources.”
Documentation for the Notebook had explained that it may take some time for the Audio Overview to be generated.

Within minutes, I was listening to audio in a podcast format of two people explaining and discussing the documents and their context in a pleasant conversation presentation. It was 19 minutes, 12 seconds in length.

A clip from this audio is here:
Infographic
Next, I decided to generate an Infographic based on the documents.
In the Generated Resource List at the bottom of the Studio Panel, there was a spinning circle to indicate that the infographic was being generated. When it was done, I could select it from the list.
I clicked on the Infographic in the list in the Studio window
and a Viewer opened up. I had options to share, download, collapse the Viewer and close the Viewer in the upper right hand corner.

After I closed the Viewer, I could click on the snowman (3 dot menu) and to be presented with options: Rename, Download, Share, Delete
This is one of the features that in BETA, but the infographic that was generated was interesting.
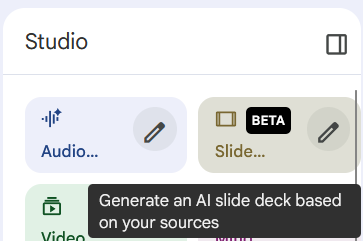
Slide Deck
An option is to generate a Slide Deck. At this time, this feature is in BETA.
I selected Slide Deck and waited while it was generated

When I clicked on the Slide Deck in the Resource List, a Viewer opened up where I could look at the slides, and interact with them.
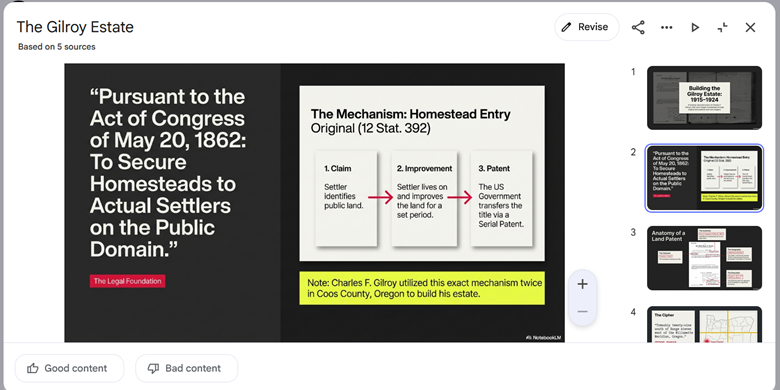
I particularly liked this slide
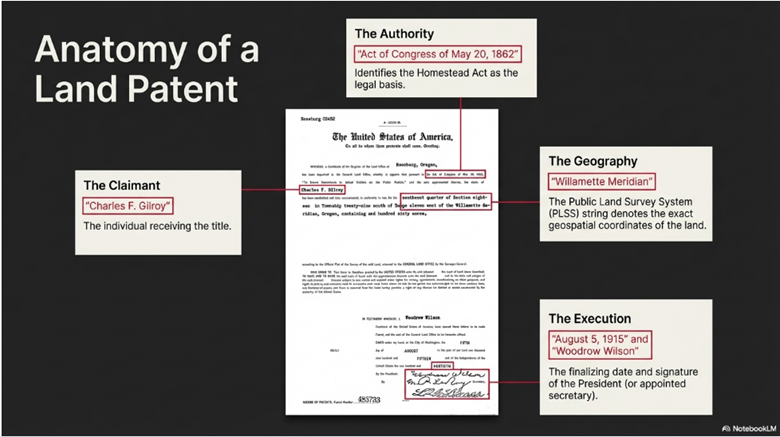
NotebookLM Generated Slide
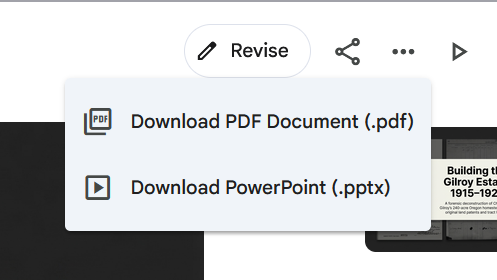
I also liked the option to download the slide deck as a PDF or a PowerPoint document.
Selecting “Revise” gives you the chance to interact and make change to the slide. The pending changes will be generated in a few minutes (or longer).
Video Overview
I selected the Video Overview Tile
and accepted the default selections, which included the longer Explainer format.
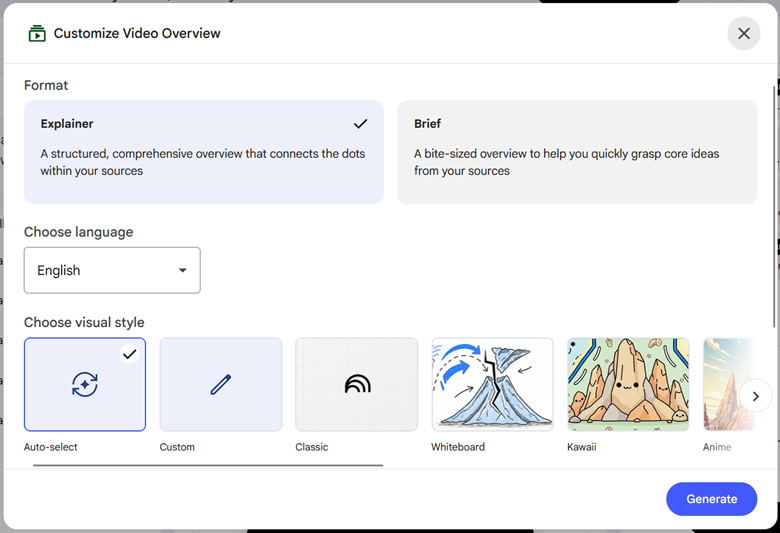
Generating that video took a long time. When I quizzed Gemini if I could find out how long it took to generate a product, I was told no, but that this task usually took from 5 to 30+ minutes.

At the end of that response, Gemini asked me if generating was taking a long time, and when I said yes, Gemini recommended that I refresh the webpage because the user interface had not updated. When I followed this recommendation, it appeared that the Video Overview generation had failed.

I deleted the Video Overview entry on the Generated Resource List, and tried again. This time I selected the option for a Brief Format.
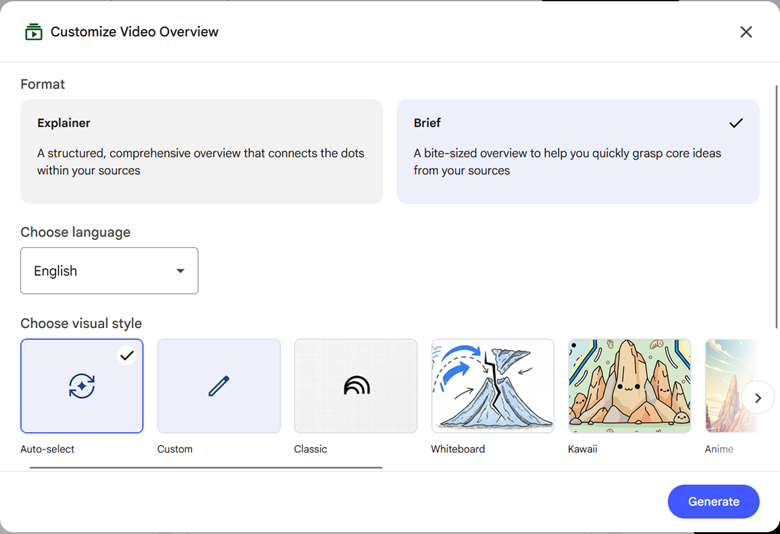
The brief format video was generated within minutes, providing me with a video 1 minute and 50 seconds long.
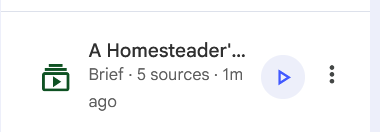
When I clicked on the Video Overview in the Generated Resource List it opened a window within the Studio Panel. The video gave the context of the Homestead Act then dove into presenting data about the two homesteads’ and their patents.
An excerpt from the video:
An Experiment in the Chat Window
I have engineering experience in testing, which matches my style of pressing the buttons and trying the features. That made me want to see if I could get some general information in a Chat within the Notebook.
I asked in the Chat window of the Notebook: If I upload a Word document with newspaper clippings can you transcribe all of them?
This was answered literally, using only the data within the Notebook. (At that point, there was no Word document in the sources containing newspaper clippings.) So if you have a general question that is not based on the information loaded into the Notebook, or have a question about how NotebookLM works it would be better to ask it in Google so that Gemini can answer it.
Gemini told me that “…if the clippings are embedded as images (e.g., photos or scans of newspaper pages), NotebookLM may not automatically transcribe that visual information into searchable, readable text” reminding me that “NotebookLM is designed to work with machine-readable text. If your Word document contains photos of newspaper clippings, the AI may be unable to “read” or transcribe the text inside those images.”
Getting back to my Notebook
When you need to revisit your Notebook, or login on a different computer, you can choose it from your list of Recent notebooks.

Current Limitations
According to Gemini, currently free accounts have limits of generating approximately 3 Audio/Video Overviews per day, and can only send 50 chat queries per day. The Free accounts are limited to 50 sources per notebook, and are limited to 100 notebooks. (Workaround for large projects: Try combining multiple, smaller documents into a single PDF or Google Doc before uploading.)
Google has a tutorial that provides good information in an overview, and it can be found at: https://sites.google.com/view/notebook-lm/tutorial
Give this a try and explore the Tiles and Chat. Let me know how you do.