Researching WWI Contractors
There is a picture of Thomas Patrick McMahon in a dough boy’s uniform, but no records can be located that document any military service. So, why was he wearing a WWI US Army uniform in a picture?
This post includes how artificial intelligence (AI) was used to begin the investigation of the answer, and how it provided context for additional work.
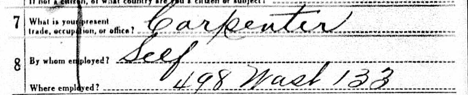
At the time of his WWI draft registration he was 25, single, and a naturalized citizen. His trade was carpenter and he was self-employed.
The answer was discovered by his descendant, my cousin, in the US Army Transport Service (US ATS) records. If you have read my books or blog, or seen me lecture, then you know how much I appreciate these records. They are a mini-census, showing details of Army personnel who were transported on US Navy ships. Thomas McMahon had sailed from Hoboken, NJ, and traveled to France as a 2nd Class Civilian Employee in the organization: U.S. Civilian Employees, U. S. Engineer Department, James Stewart & Co. Contract, on Agamemnon and returned on
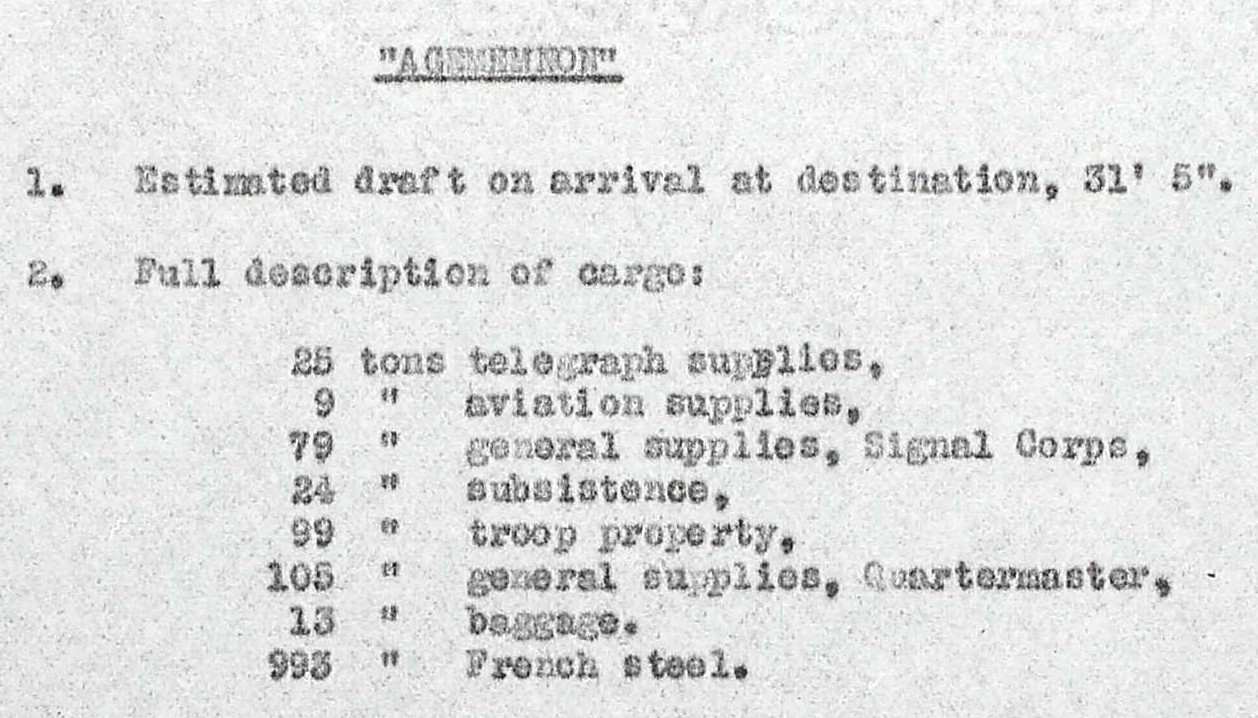
The US ATS records found online are digitized of records that were originally stored in folders; there was one folder for each sailing. When you find a manifest containing an entry with the person you are researching, I recommend going backwards through the images to the front of the set to locate the pages containing details about the sailing. In this case, the front images contained the description of cargo that was transported on Agamemnon to France (both handwritten and typed) was interesting. Agamemnon was transporting 25 tons of telegraph supplies, 9 tons of aviation supplies, 79 tons of Signal Corps General supplies, 993 tons of French steel, and other supplies.
The Naval History and Heritage Command (NHHC) provided information about Agamemnon (Id. No. 3004) during 1917-1919, which included her voyage to Europe in mid-January 1918. Five days into the voyage the convoy faced heavy seas, and Agamemnon turned on lights and circled back after a report of a man overboard. Falling into a trough, a 43-degree roll caused the loss of some material. Fortunately, no one was lost. She continued on for a brief stop at St. Nazaire, then on to Brest where she docked on 24 January.
The images at the front also included information about the cablegram received by the Navy Department stating that the ship had made it safely to France.
I decided to use AI as an assistant to strategize how to learn more about contractors in WWI and the specific contractor.
ChatGPT provided some information about the engineering effort during WWI, and recommendations about where to search. It suggested searching in NARA’s Record Group 77, which contains records for the Army Engineers which would have information about the contracts let by the organization. I suspect all that we might find is what the contract was for; it would be up to the company to find the people to fill the roles.
Google Gemini was more helpful in this case.
Gemini explained that uniforms were worn by civilians so that they would not be mistaken for spies if captured, and they would receive treatment under the Geneva Convention. (This explains photographs of civilians wearing uniforms in war zones!) It also shared information about James Stewart & Co. recruiting a skilled workforce for infrastructure project in France, such as piers, warehouses, fuel tanks and depots.
It captured its findings in a nifty report WWI Civilian Contractor Research Report
Subject: James Stewart & Company | Port of Brest | Militarized Civilians
Gemini referred me to a source: United States Army in the World War 1917-1919 General Orders, GHQ, AEF, Volume 16. This volume was one of seventeen which compiled selected American Expeditionary Forces (AEF) records. Volume 16 captured all of the General Orders given by General Pershing.
The General Orders contain directives issued from the top, the General Headquarters. They dictated the command structure, logistical support, and standards of conduct for the entire force. I scanned these orders for the reference material that Gemini promised. I did not find details of the contractors’ uniforms in the G.O.’s listed by Gemini. There were many references to uniforms, but I did not find full details of the contractors’ uniforms. G.O. 46, 1917, did have details about the uniforms worn by the French interpreters, including the sphinx insignia they wore. G.O. No. 63, 20 Nov 1917, address identity cards which were required for all the AEF and the militarized civilians. There were G.O.’s with details of civilian pay. Additionally, G.O. No. 30, 15 Feb 1918, IV. 7. (n)(1) “Two aluminum identification tags, to be furnished by the Q. M. C. [Quarter Master Corps], will be habitually worn by all officers and enlisted men, and also by all civilians attached to the A. E. F.” G.O. No. 23, 20 Aug 1917, 1. 5. discussed the importance of clerks and civilians in uniform saluting officers.
Thomas P. McMahon traveled back to the U.S. on the U.S.A.C.T. Honolulu, which sailed from France on 1 Dec 1918. He arrived at Newport News, VA, on 21 Dec 1918. His Group or Classification was shown as “Civilians for Discharge.”
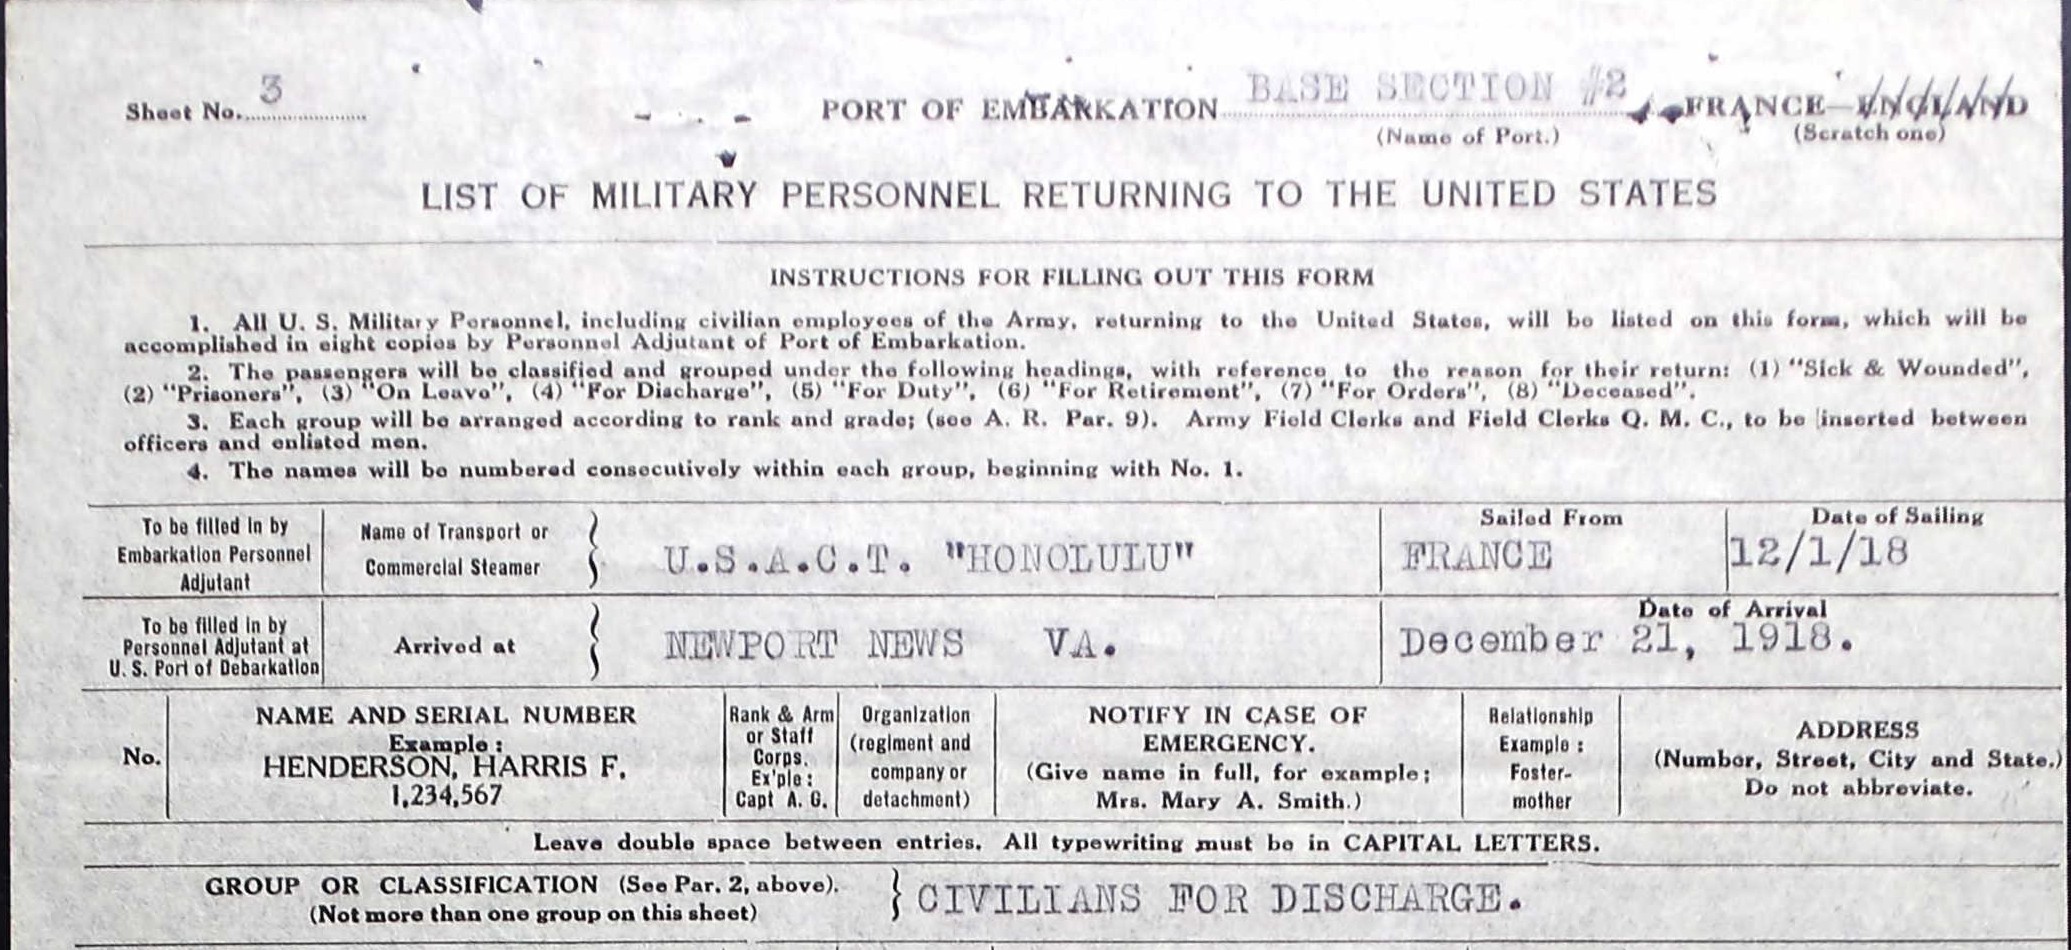
The war was over for Thomas, and he was back home in the U.S. for Christmas. His brother, my grandfather, would march to Germany after the Armistice and participate in the Army of Occupation. He would return in July of 1919.
I had one question left. From the information I could find about the contractor, Thomas was probably working at Brest. (The NHHC excerpt did not indicate any one/thing leaving the ship at St. Nazaire.) If Thomas were working at the port of Brest when Joseph arrived in August 1918, did they see each other? In the activity of that port, it would be remarkable if they might have
seen each other, but the 51st PIR spent time at the port unloading the Kroonland
after they arrived (joys of being a Pioneer Infantryman!), so maybe, just maybe.
Fortunately I was able to locate “A Century of Construction (1844–1944)” James Stewart & Co.” through an interlibrary loan. While work done in the United States and around the world was documented, little was recorded about WWI in the narrative. WWII was much better documented. There was a table listing War Construction projects in the United States during WWI. There was also a table of projects done for the American Expeditionary Forces in France. Brest was not listed among them, but St. Nazaire was. It may be that the list was incomplete, or that he worked in another place. Either way, there is more to learn.