It’s Complicated: Marital Status State Diagrams
When you are looking for records, you have to play to your strengths. State diagrams are important in my field of Computer Science and Engineer. They show the state that a computer can be in, and how it moves from one to another via a transition. State diagrams are merely roadmaps showing how to move through a computer system in time. For football fans, John Madden uses something similar to show how plays are made.
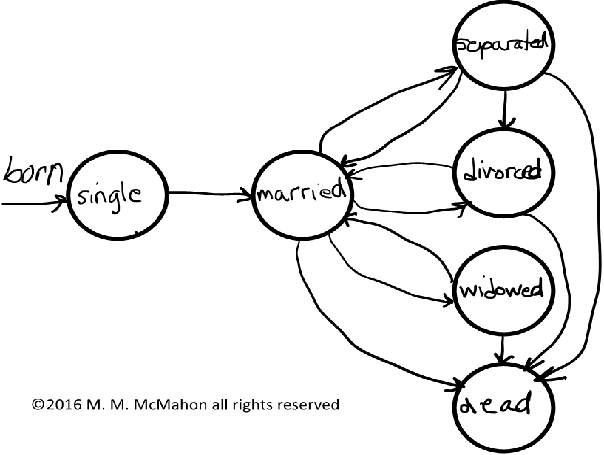
While I was trying to formulate how to continue searching for records of a married ancestor, I enumerated all the possible variations of her marital status that there could be. She might remain separated, divorce, remarry or die. It occurred to me that this path through life could be captured in a state diagram! So I got out my tablet and did some drawing.
When a person is born, she is single. She might die single or marry during her lifetime. If she marries, then she is a married person. You can follow the arrows from her single state to either of these. A married person can be separated, divorced, widowed, or dead. As you can see by following the arrows, a separated, divorced or widowed person can marry again. Then her status would go back to married. For a woman, this probably means a change in surname, and that is where your search becomes more complicated.
If you might want capture more information, by adding another status like “engaged” or “it’s complicated”.
This really helped me to focus my searches for the ancestor in one particular geographic area. It reminded me to check the available marriage and death records.
This particular diagram only captures changes in marital status. If you still cannot find a person, keep in mind that people also move or migrate.


